💓 If you enjoyed the information and the web site, please donate.

Want to know why I decided to pursue a Master’s in Data Science? Go here
Looking for DTSC 650 week 1? Week 1
Looking for DTSC 650 week 2? Week 2
Looking for DTSC 650 week 3? Week 3
Looking for DTSC 650 week 5? Week 5
Looking for DTSC 650 week 6? Week 6
Looking for DTSC 650 week 7? Week 7
💡 Learning Objectives
- Utilize ggplot2 to create effective graphical representations of data
- Articulate the logic behind the grammar of graphics
💪🏿 This is what I accomplished my fourth week in the DTSC 650 course:
📺 Videos Watched (these videos follow along with the book):
- Assumptions Introduction
- Assumptions Part 1
- Normality
- Checking Assumptions
- Homogeneity of Variance
- Violations of Normality
- Visualizing Assumptions
- An Example
- Odds and Ends
👀 Read this article:
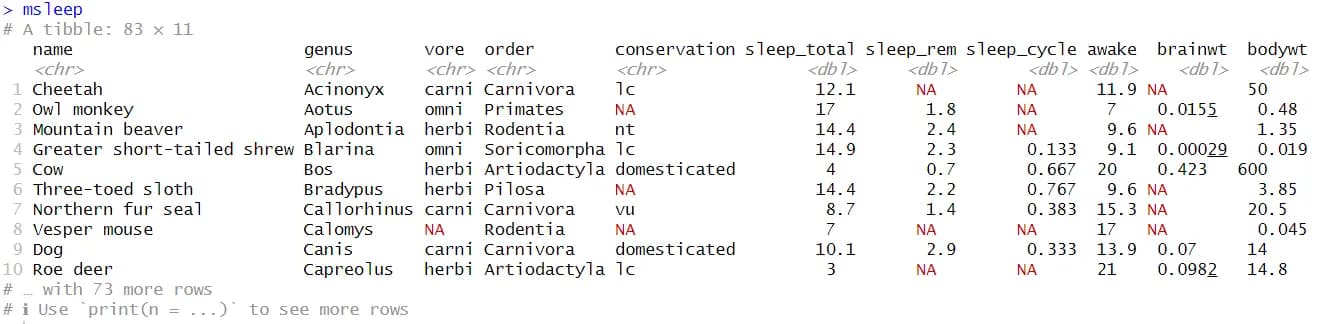
🧪 Coding Assignments There are 2 coding assignments I completed this week that are graded. I did calculations like var, mean, and utilized pipes. They are submitted to an automated grading system (CodeGrade) that is very finicky:
- nycflights13 utilizes the tidyverse and nycflights13 packages.
- msleep utilizes the tidyverse packages which has the msleep dataset already inside it.
💯 Exam
- An exam on Model-Building & Assumptions with 11 questions. Lots of fill in the blanks and questions with multiple answers.
- You can take the exam as many times as needed to get the score you want, but each test has different questions. I took the exam 1 time. Final score was 90.00% as I missed one. You have until the end of the semester to take all your exams. I’ll see how I do when I start turning in graded assignments on if I need to retake this test.
🔥 Summary
- Another easy week with just watching videos, completing a few problems, and a short test.
Stay tuned for week 5…
💓 If you enjoyed the information and the web site, please donate.
⚡ Use NordVPN for the protection you need when surfing the web. One of the few providers that have a dedicated IP address you can buy to increase your safety.
 Elyse Y. Robinson, an enterprising entrepreneur, is the mastermind behind Taxes and Services, a multifaceted holding company that doubles as her accounting firm. Her ventures encompass an array of innovative projects. One of her key initiatives is Switch Into Tech, a dynamic weekly newsletter that doubles as a platform for advertising monthly career seminars, offering weekly tech-related freebies, and promoting her latest podcast episodes of Nobody Wants To Work Tho. Additionally, Elyse shares her insights through her blog at Data.gal, where she delves into various data-related topics. Elyse’s passions extend beyond her businesses; she is deeply enamored with Mexico, has an insatiable appetite for research, and is dedicated to assisting others in transitioning into technology careers.